Data is everywhere today. Every sale, every click, every support ticket, every website visit – it all leaves a digital footprint. Studies suggest that data-driven companies see productivity jump by over 5% and profitability rise by more than 6%. Yet, many organizations still rely heavily on gut feeling and intuition.
That’s where performance analytics comes in.
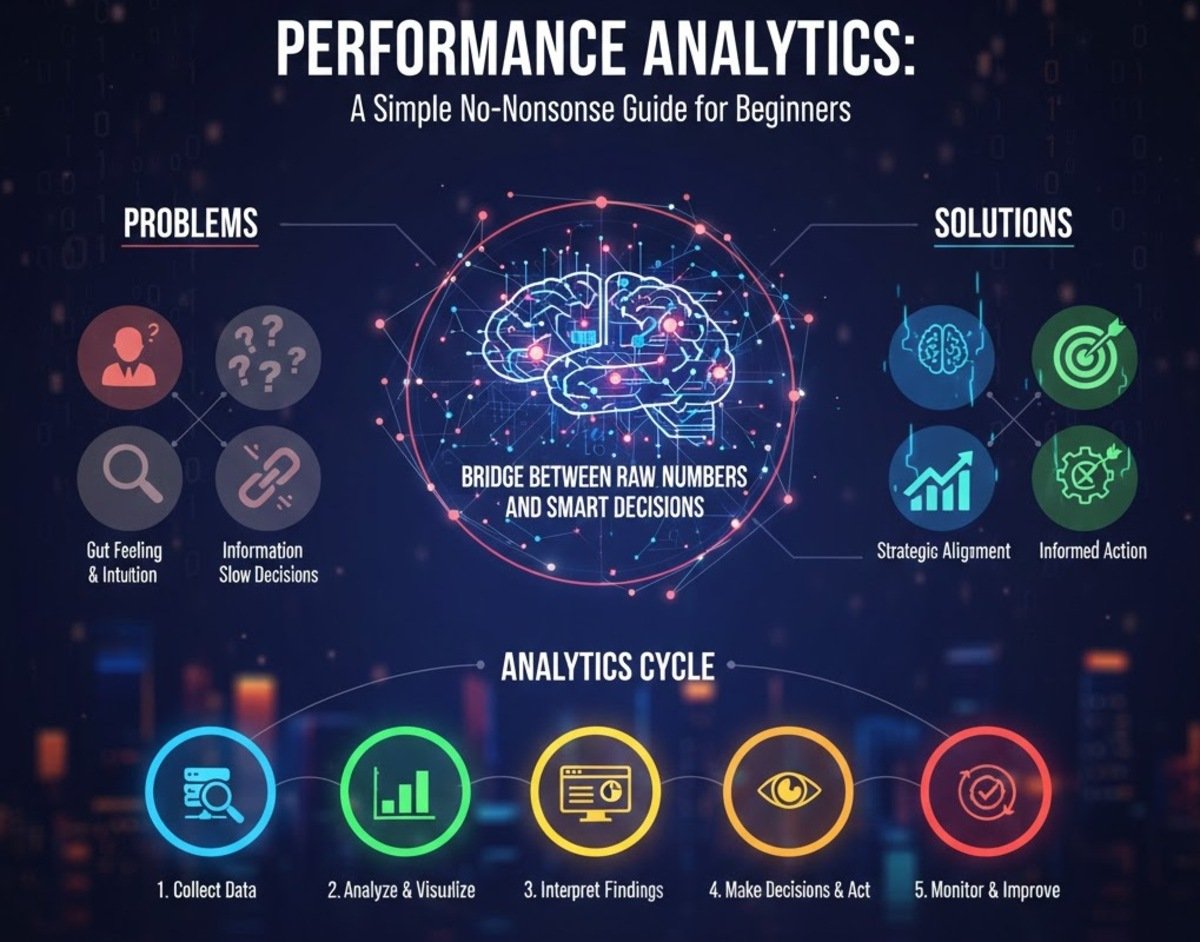
Think of it as the bridge between raw numbers and smart decisions. It helps you see what’s really working, what’s slowing you down, and where the next big opportunity lies. Instead of arguing over opinions, teams can look at facts, trends, and evidence.
In this beginner-friendly guide, we’ll break down performance analytics in a simple, conversational way – no jargon overload, just practical insights you can actually use.
What Is Performance Analytics?
Performance analytics is the practice of measuring, tracking, and analyzing how well your business, systems, teams, or processes are performing over time – using data, not assumptions.
Rather than asking, “How do we feel we’re doing?”, performance analytics asks, “What do the numbers say?”
It typically involves:
-
Tracking activities and results against clear goals
-
Spotting trends, patterns, and anomalies
-
Understanding why things improved or declined
-
Using those insights to make better decisions
You can apply performance analytics to almost any area of a business:
-
Operations
-
Sales and marketing
-
HR and workforce performance
-
IT systems and digital platforms
The ultimate goal is always the same: improvement through informed action.
Why Is Performance Analytics So Important?
Business today moves fast. Customer expectations change. Costs go up and down. Competitors launch new products overnight. If you rely only on instinct in this environment, you’re basically driving with your eyes half-closed.
Performance analytics changes that. Here’s how.
1. It replaces guesswork with clarity
Instead of “I think”, you get “We know”.
-
Teams focus on facts, not opinions
-
Decisions become faster and more confident
-
Discussions shift from blame to problem-solving
2. It keeps everyone focused on what matters
You can track hundreds of metrics, but not all of them matter. Performance analytics helps you:
-
Zero in on metrics that actually align with business goals
-
Avoid data overload
-
Use time and resources wisely
3. It boosts accountability without micromanagement
When performance is visible:
-
People understand what’s expected
-
Leaders can track progress without breathing down everyone’s neck
-
Teams see how their work links to bigger company goals
This creates transparency, trust, and alignment.
4. It supports long-term success
With good analytics, you’re not just reacting. You’re:
-
Spotting problems early
-
Seeing opportunities sooner
-
Making changes before things break
That’s how companies stay competitive over the long run.
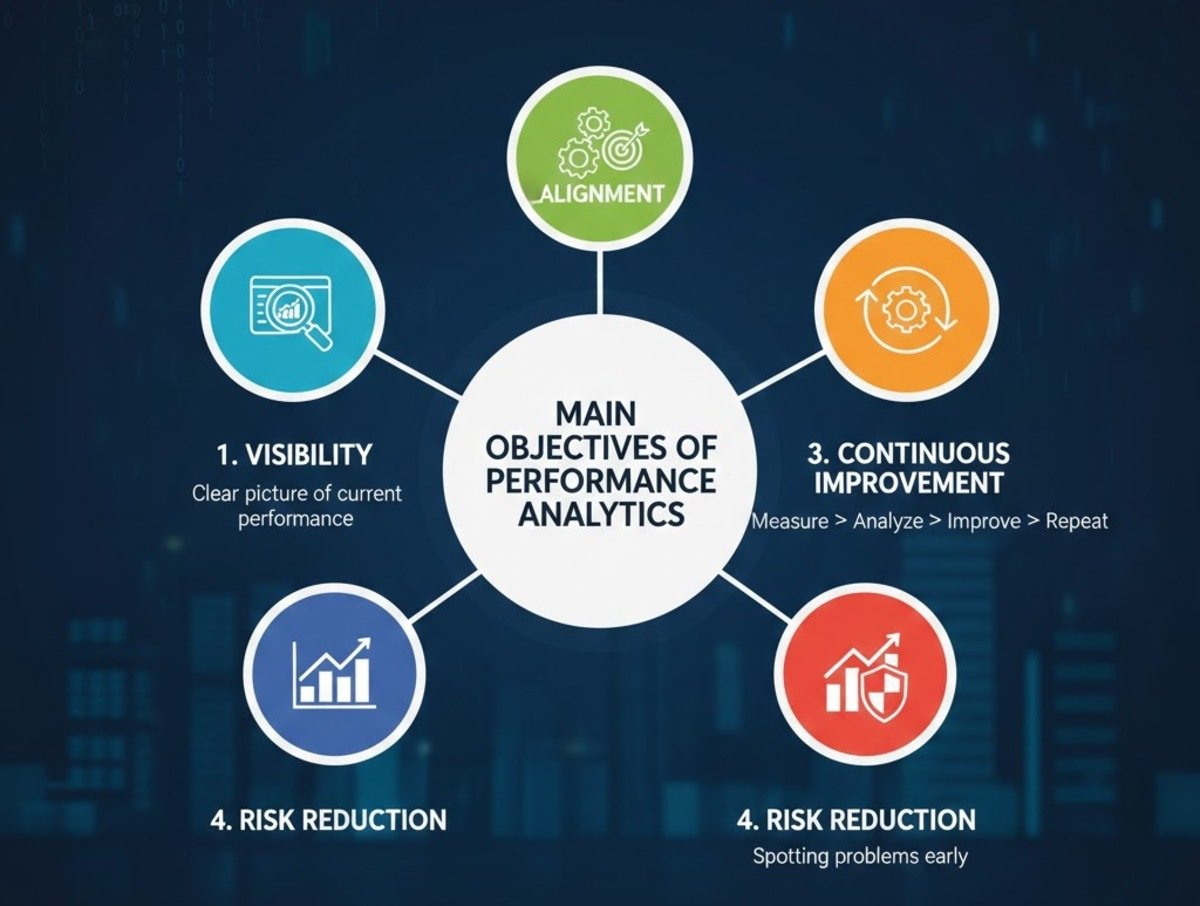
Main Objectives of Performance Analytics
So, what are businesses actually trying to achieve with performance analytics? Let’s break it down into a few core objectives.
1. Visibility
First, you need a clear picture of what’s going on.
-
How are we performing right now?
-
Are we ahead or behind targets?
-
Which areas are strong, and which are struggling?
Good analytics gives leaders and teams a shared “single source of truth”.
2. Alignment
Analytics helps connect the dots between daily work and strategic goals.
-
Are teams working on things that actually support the company’s direction?
-
Do people know how their tasks impact overall results?
When the data shows this connection clearly, alignment follows naturally.
3. Continuous Improvement
Performance analytics is not a one-time project. It’s a loop.
-
Measure → Analyse → Improve → Repeat
This helps:
-
Identify gaps
-
Build on strengths
-
Turn every result (good or bad) into a lesson
4. Risk Reduction
Spotting trouble early is half the battle.
-
Declining sales
-
Rising customer complaints
-
System performance issues
Analytics helps you detect these signs before they become major problems, protecting revenue, reputation, and resources.
How Does Performance Analytics Actually Work?
You might be thinking: “Okay, this sounds great in theory. But what does it look like in practice?”
Let’s walk through the typical cycle.
1. Collect data from multiple sources
Businesses pull data from places like:
-
Financial systems
-
CRM tools (sales and customer data)
-
HR systems
-
Operations and logistics tools
-
Websites and apps
-
Customer support platforms
The idea is to gather a complete, accurate picture of performance.
2. Analyse the data
Raw data on its own isn’t useful. You need to:
-
Clean it (remove errors, duplicates, inconsistencies)
-
Process it
-
Use analytics tools, models, and visualizations (like dashboards, charts, and reports)
This step reveals:
-
Trends (e.g., sales rising in one region but falling in another)
-
Patterns (e.g., customer churn after certain events)
-
Relationships (e.g., higher response time → lower satisfaction)
3. Interpret the findings
Now comes the human part.
-
Managers and analysts review the results
-
They identify key performance indicators (KPIs) and assess progress
-
They highlight strengths and weak spots
At this stage, data turns into insights: “This is what’s happening and why it might be happening.”
4. Make decisions and take action
Insights are only valuable if they lead to action.
-
Adjust strategies
-
Fix broken processes
-
Reallocate budgets
-
Launch new initiatives
Because these decisions are data-backed, they’re usually more effective and less risky.
5. Monitor continuously
Performance analytics is not a “set and forget” process.
-
You keep tracking
-
You keep adjusting
-
You keep learning
This continuous cycle gives businesses the agility to respond quickly to market changes, shifting customer expectations, and operational issues.
Types of Performance Analytics (And When to Use Each)
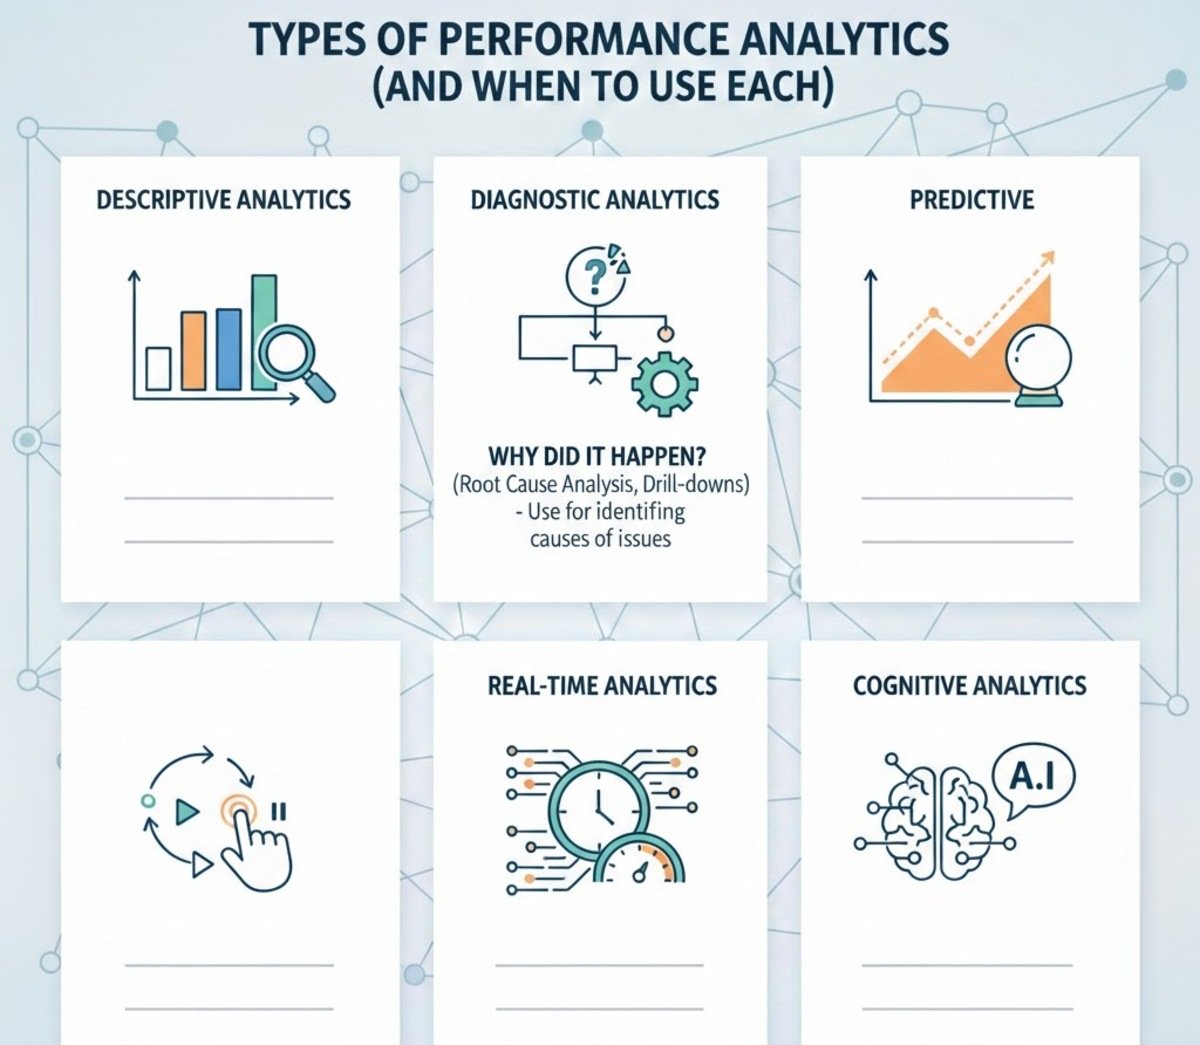
Not all analytics is the same. Different types answer different questions. When you combine them, you get a powerful, complete view of performance.
1. Descriptive Analytics – “What happened?”
This is the starting point.
-
Summarizes past data
-
Shows what has already happened
-
Often presented in dashboards, reports, charts
Example:
Monthly sales report showing revenue by region over the last year.
Descriptive analytics helps you understand your history without necessarily explaining the reasons.
2. Diagnostic Analytics – “Why did it happen?”
Here, you go a level deeper.
-
Explores relationships and patterns
-
Tries to uncover the root causes behind performance changes
Example:
You see a drop in sales in one region. Diagnostic analytics helps you find out if it was due to pricing changes, competitor moves, low inventory, or poor marketing.
It answers the “why” behind the numbers.
3. Predictive Analytics – “What is likely to happen?”
Think of this as your data-powered “crystal ball”.
-
Uses historical data and patterns
-
Applies statistical models and machine learning
-
Predicts future trends or outcomes
Example:
Forecasting next quarter’s sales or predicting which customers are likely to churn.
This helps businesses prepare in advance and plan more accurately.
4. Prescriptive Analytics – “What should we do next?”
This type suggests possible actions.
-
Builds on descriptive, diagnostic, and predictive analytics
-
Simulates scenarios and recommends the best options
Example:
Given current demand forecasts, prescriptive analytics might suggest how much inventory to stock in each warehouse.
It doesn’t just tell you what might happen – it tells you what to do about it.
5. Advanced Analytics – “What are we missing?”
Advanced analytics deals with complex, large-scale, or highly detailed data.
-
Uses sophisticated models
-
Handles big data and complex operations
-
Finds insights that basic analysis might miss
This is often used by large enterprises with massive datasets and intricate processes.
6. Real-time Analytics – “What’s happening right now?”
This is analytics on the move.
-
Tracks performance as it happens
-
Allows instant responses
Examples:
-
Monitoring website traffic live
-
Watching real-time order volume
-
Tracking system performance second by second
In fast-paced environments (e-commerce, trading, logistics, customer support), real-time analytics can be the difference between catching an issue early and dealing with a crisis later.
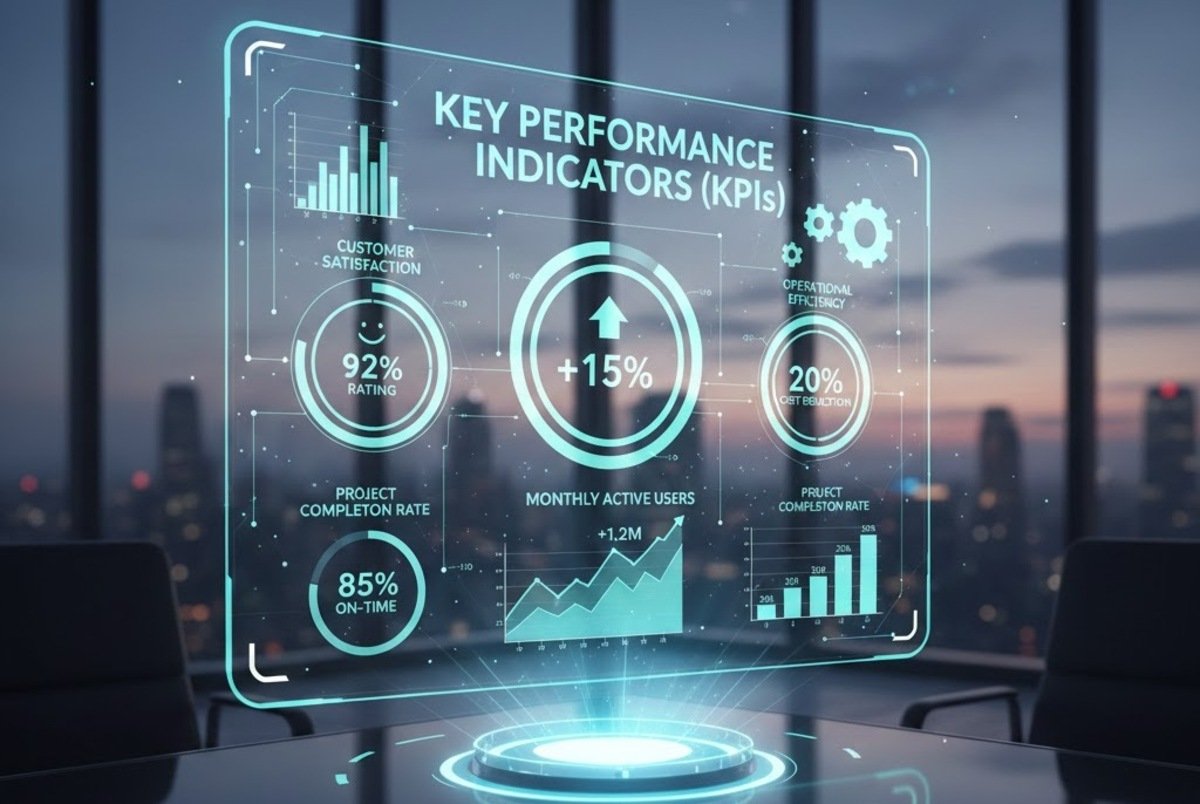
Key Performance Indicators (KPIs) in Performance Analytics
Key Performance Indicators (KPIs) are the backbone of performance analytics. They’re the numbers that tell you if you’re on track or off course.
Why are KPIs so important?
-
They provide a clear way to measure progress
-
They highlight problem areas quickly
-
They help align individual goals with company goals
-
They reinforce a culture of performance and accountability
When employees know which KPIs matter, they can focus their energy on what truly drives success.
Here are some common KPIs used in performance analytics:
-
Revenue: Total money generated over a period
-
Profit: Money left after subtracting costs from revenue
-
Customer satisfaction: Often measured through surveys, ratings, or NPS
-
Employee satisfaction: Reflects how engaged and happy employees are
-
Productivity: Output relative to resources (time, people, money)
The right KPIs will depend on your industry, goals, and business model – but they should always be clear, measurable, and meaningful.
Benefits of Performance Analytics
When done well, performance analytics can fundamentally change how an organization operates. Let’s look at some of the biggest benefits.
1. Improved visibility across operations
You get a clear, up-to-date picture of:
-
How teams are performing
-
How processes are running
-
Where bottlenecks or inefficiencies are emerging
Instead of flying blind, leaders can see what’s actually happening across the business.
2. Data-driven decision-making
Decisions backed by accurate data:
-
Reduce guesswork
-
Lower the risk of costly mistakes
-
Make it easier to justify choices to stakeholders
Performance analytics surfaces the trends, behaviors, and patterns that guide smarter decisions.
3. Increased operational efficiency
Analytics helps you:
-
Spot waste
-
Identify slow or clunky processes
-
Find underused resources
With those insights, you can streamline workflows, automate routine tasks, and optimize resources – which often leads to lower costs and better output.
4. Stronger accountability and fair evaluation
When metrics are transparent:
-
Everyone knows what “good performance” looks like
-
Evaluations feel fairer and more objective
-
Teams understand exactly how their work will be measured
This encourages responsibility and reduces confusion or frustration.
5. Support for continuous improvement
Because performance is monitored regularly, companies can:
-
Make small adjustments often, instead of big, disruptive changes occasionally
-
Learn from both successes and failures
-
Keep improving even when things are already going well
It creates a culture where feedback and learning never really stop.
6. Better alignment with business goals
When KPIs and performance metrics align with strategic goals:
-
Departments pull in the same direction
-
Communication between teams improves
-
Progress towards company-wide objectives becomes smoother and more consistent
Everyone knows not just what they’re doing – but why they’re doing it.
7. Faster response to change
Markets shift. Customer expectations evolve. Things break.
Performance analytics helps you:
-
Detect decline or change early
-
Respond quickly to new challenges or opportunities
-
Stay competitive instead of constantly playing catch-up
In short, you become proactive, not reactive.
Common Challenges in Performance Analytics
Of course, it’s not all smooth sailing. Many organizations face similar hurdles when trying to implement performance analytics.
1. Poor data quality
If your data is:
-
Incomplete
-
Inaccurate
-
Outdated
Then your insights will be unreliable. “Garbage in, garbage out” applies here.
2. Integration issues
Different systems store data in different formats and locations. Without good integration:
-
Data becomes fragmented
-
You miss the full picture
-
Reporting becomes slow and painful
Bringing everything together into a unified view can be hard, but it’s essential.
3. Lack of skills and understanding
Even the best tools fail if teams don’t know how to use or interpret them.
-
Misreading data leads to bad decisions
-
People may distrust data they don’t understand
-
Analytics initiatives can stall without basic data literacy
Training and education are key.
4. Cultural resistance
Moving from intuition to data-driven thinking can feel uncomfortable.
-
Some leaders may resist being challenged by numbers
-
Teams may fear being “judged” by metrics
-
Change requires communication and strong leadership support
Without a supportive culture, analytics often stays underused.
Performance Analytics vs. Performance Appraisals
These two terms sound similar, but they focus on different things.
-
Performance analytics: Looks at business processes, systems, and outcomes
-
Performance appraisals: Focuses on individual employee performance
Here’s the basic difference:
-
Performance analytics is data-driven, continuous, and system-focused
-
Performance appraisals are often periodic, based on manager evaluations, and people-focused
You use performance analytics to improve how the business operates.
You use performance appraisals to evaluate and grow employees.
Both matter. But mixing them up can lead to confusion and unfair expectations.
Traditional Performance Review vs. Performance Analytics
Traditional performance reviews:
-
Happen once or twice a year
-
Rely heavily on memory and opinion
-
Focus on the past
-
Are often reactive (“You didn’t hit your goals last quarter…”)
Performance analytics:
-
Runs continuously
-
Uses objective, real-time or ongoing data
-
Focuses on trends and patterns
-
Helps you act proactively (“We see a dip forming; let’s fix it now.”)
In modern organizations, analytics doesn’t replace human feedback – it strengthens it.
How to Execute Performance Analytics (Step by Step)
If you’re thinking, “This all sounds good, but where do we start?”, here’s a practical roadmap.
1. Set clear objectives
Be specific.
-
Do you want to improve productivity?
-
Reduce employee turnover?
-
Increase customer satisfaction?
-
Align employee goals with business goals?
Clear objectives lead to meaningful metrics and relevant insights.
2. Define a simple workflow
Decide:
-
Who will collect data
-
Who will analyse it
-
Who will act on the findings
Clarity around roles prevents confusion later.
3. Choose the right KPIs
Pick KPIs that:
-
Directly reflect your goals
-
Are measurable and reliable
-
People can understand easily
Don’t track everything. Track what matters.
4. Use trusted data sources
Ensure your data is:
-
Accurate
-
Consistent
-
Secure
-
Well-integrated across systems
Weak foundations lead to weak insights.
5. Get buy-in from managers and employees
Explain:
-
Why you’re using performance analytics
-
How it benefits teams, not just management
-
How data will (and won’t) be used
Transparency builds trust and drives adoption.
6. Invest in tools and training
Choose software that fits your needs and complexity. Then:
-
Train teams on how to read dashboards and reports
-
Build basic data literacy
-
Encourage questions and learning
The tool is only as powerful as the people using it.
7. Benchmark and track over time
Compare:
-
Current results vs. past performance
-
Your numbers vs. industry standards (where possible)
This context helps you see what “good” actually looks like.
8. Focus on actionable insights
Don’t drown in numbers.
Ask:
-
“What should we do differently because of this data?”
-
“Which changes will have the biggest impact?”
Turn insights into concrete actions, timelines, and responsibilities.
9. Protect privacy and data security
Especially when people-related data is involved:
-
Limit access appropriately
-
Follow data protection rules and regulations
-
Communicate how data is used and protected
Ethical use of data is non-negotiable.
10. Plan for growth
As your business grows:
-
Your data will grow
-
Your questions will get more complex
-
Your tools and processes must scale
Choose flexible systems and keep improving the analytics process itself.
Mastering Business Performance Analytics in Clear Steps
Let’s simplify the journey into ten straightforward steps you can follow:
-
Set clear objectives
Decide what success looks like. Think: higher engagement, lower churn, better productivity. -
Identify relevant KPIs
Pick metrics that directly reflect your goals and make sense to your teams. -
Collect and integrate data
Pull from reports, surveys, feedback tools, financial systems, and performance records. Ensure accuracy and consistency. -
Create dashboards and reports
Use visuals to make data easy to understand. Good dashboards tell a story at a glance. -
Benchmark and compare
Look at past performance and, where possible, industry benchmarks to spot gaps and strengths. -
Conduct root cause analysis
Use techniques like the “five whys” to dig into why performance issues are happening. -
Analyse performance drivers
Combine quantitative data with qualitative feedback from teams to understand what really influences results. -
Identify trends and patterns
Look for recurring themes over time. These often explain why results keep going up or down. -
Plan and implement actions
Turn insights into action plans with owners, timelines, and measurable targets. -
Maintain continuous feedback
Encourage regular check-ins and discussions. Adjust strategies as new data comes in.
Follow this loop consistently, and performance analytics becomes part of how you run the business – not just a side project.
Popular Tools Used in Performance Analytics
You don’t need to build everything from scratch. Many platforms already support performance analytics across different business areas.
ServiceNow Performance Analytics
-
Focuses on workflows, service delivery, and process efficiency
-
Offers real-time dashboards and trend tracking
-
Helps identify performance gaps early and improve operations continuously
Ideal for: IT service management and operational performance tracking.
SAP SuccessFactors
-
Centres on workforce and HR performance
-
Tracks employee engagement, productivity, and goal alignment
-
Connects individual goals with company objectives
Ideal for: HR teams that want stronger talent management and people analytics.
Salesforce
-
Widely used for sales and customer performance analytics
-
Tracks pipeline health, customer behavior, and revenue trends
-
Provides dashboards and reports for sales, marketing, and service teams
Ideal for: Businesses focused on customer relationships, sales growth, and retention.
NetApp
-
Monitors infrastructure and data management performance
-
Tracks storage usage, system reliability, and data availability
-
Helps IT teams prevent performance issues before they affect users
Ideal for: Organizations with large, complex digital infrastructure.
Microsoft Dynamics 365 Finance
-
Provides deep insight into financial performance
-
Tracks cash flow, revenue, expenses, and profitability
-
Helps align budgets and spending with strategic goals
Ideal for: Finance teams that want real-time, detailed financial analytics.
Real-World Use Cases of Performance Analytics
To make this more tangible, let’s look at some practical examples.
1. Sales analytics
Performance analytics in sales can:
-
Track revenue growth over time
-
Monitor conversion rates at each stage of the pipeline
-
Highlight top-performing products, regions, or reps
Result: Sales teams refine strategies, focus on the right leads, and improve win rates.
2. Supply chain and operations
In supply chain management, analytics helps:
-
Monitor inventory levels and stockouts
-
Track delivery times and logistics performance
-
Evaluate supplier reliability and costs
Result: Reduced delays, lower costs, and smoother operations.
3. Website and digital performance
For websites and apps, analytics can:
-
Measure page load speed
-
Track visitor behavior and navigation paths
-
Monitor engagement and conversion rates
Result: Better user experience, higher conversions, and more informed design decisions.
Across all these cases, the pattern is the same: data guides improvement and supports better, faster decisions.
Conclusion
Performance analytics is no longer a “nice-to-have”. It’s a must-have if you want to stay competitive, efficient, and customer-focused.
It takes the overwhelming amount of data your business already generates and turns it into something truly valuable: clarity.
With it, you can:
-
See what’s really happening across your systems, teams, and processes
-
Understand why results are changing
-
Predict what might happen next
-
Decide what to do about it with confidence
Over time, performance analytics becomes a long-term advantage. Teams align around shared goals. Leaders rely less on hunches and more on evidence. And gradually, results improve across every corner of the organization.
Investing in performance analytics today isn’t just about dashboards and reports. It’s about building a smarter, more resilient business that’s ready for the future.